Source: www.glos.ac.uk. All Rights Reserved. 2024 University of Gloucestershire
Last updated: 30 March 2023
The University of Gloucestershire is committed to advancing equality and valuing diversity in all of its practices. We are developing a culture that actively respects and values differences, recognising that staff and students from different backgrounds, cultures and experiences bring valuable insight to the university; that actively combats prejudice, discrimination and harassment by raising awareness and challenging attitudes. We continue to create fair and open policies and processes that encourage and facilitate staff and students to develop and progress, achieving their true potential
Our 2017 Staff Survey results were positive:
“The university is a people-based organisation. Achievement of all our goals depends on the skills, professionalism and engagement of our staff. The highest priority amongst our enablers is therefore to recruit, retain and motivate excellent staff, and to create a working environment in which all staff can achieve their full potential and be part of the transformational purpose of the university.”
Given our Staff Survey results, our successes to date and the focus in our Strategic Plan, our current gender pay gap is disappointing. We understand that the data contained within this paper needs addressing. This disparity is unacceptable and we are keen to play our role in achieving real gender equality.
We welcome the opportunity to report on our gender pay gap. Whilst it is the first time that we have reported specifically on gender pay, we have been undertaking equal pay reviews since 2011.
At this point it is useful to explain the difference between equal pay and a gender pay gap. Equal pay refers to the differences in pay between men and women who carry out like work – work that is broadly similar: work rated as equivalent under a job evaluation scheme, or work found to be of equal value in terms of effort, skill or decision making. A gender pay gap shows the difference in average pay between men and women, regardless of grade.
Our 2016 Equal Pay Review showed some very positive news, revealing a mean gender gap of only 1.97% amongst our academic staff. Whilst there is no legal definition of what constitutes a pay gap, it is generally accepted that a gap of between 3% – 4.9% warrants further investigation, whereas 5% and above is regarded as significant.
In relation to our professional services staff, the review identified a larger mean gender pay gap of 8.31%. This gap occurred because of a disproportionate number of women employed in the lower grades. This picture is consistent with the data in our Gender Pay Gap Report, and is reflective of the trend in the Higher Education sector.
Another contributory factor was the relatively long length of service amongst our workforce. Whilst this has a number of benefits, it can become a barrier to overcoming gender related occupational segregation.
Our Equal Pay Review and our Gender Pay Gap Report also indicated an under-representation of women in senior roles, which increased at Executive level. Due to the relatively small numbers of employees at this level, the ratios are sensitive to any changes.
We undertook further analysis of our quartiles gender pay gap data to better understand our data. The only gap highlighted by this analysis was in the upper middle quartile.
Our gender pay data is based on calculations for our workforce as a whole. For the purpose of the calculations, the university’s workforce was 1,280 with a gender profile which is 56% female and 44% male.
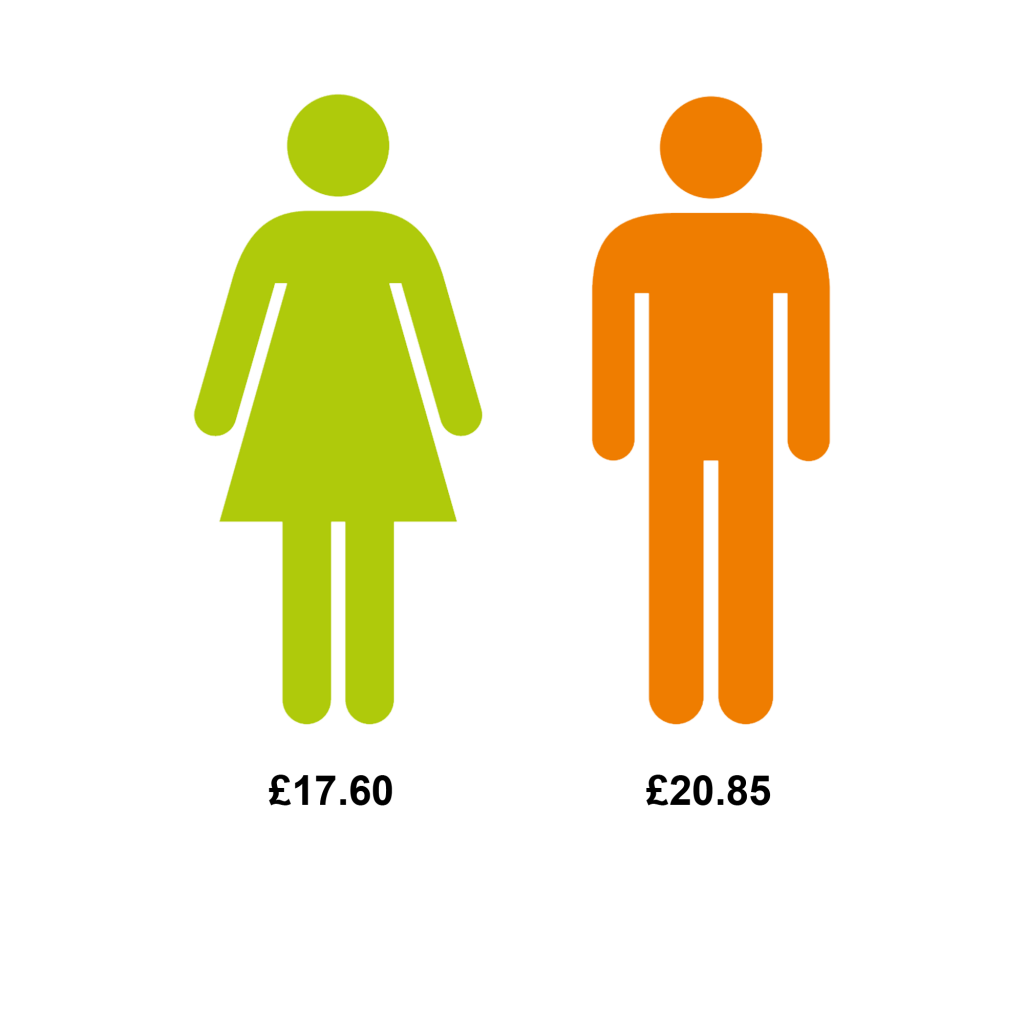
The mean and median gender pay gap is based on an hourly rate of pay calculated in accordance with the regulations**.

The mean and median bonus gender pay gap and the proportion of men and women receiving a bonus payment:
*The workforce profile is based on a snapshot of relevant, full pay employees as at March 2017. The prescriptive nature of the regulations** means that the hourly rates of pay are approximate to our own pay scales.
**Equality Act 2010 (Specific Duties and Public Authorities) Regulations 2017.
Here we show the proportion of men and women in each quartile pay band.
Each quartile is calculated by dividing the workforce into four equal parts. For us this equates to 320 employees per quartile. To gain a better understanding of our gender pay gap, we undertook further analysis of each quartile. This identified a gap within the upper middle quartile.
Mean gap is 0.19%
Mean gap is 3.61%
Mean gap is 1.92%
Mean gap is -0.37%
We recognise that sustained and purposeful change will take time, and the impact of our short term measures will only be effective in the longer term. Our data indicates that our biggest challenge lies in the under representation of women at senior grades, and occupational segregation at the lower grades. With this in mind, our primary actions will focus on recruitment and selection.
We will:
Other actions that we will continue to develop and implement are: